GEDI Canopy Transect Explorer
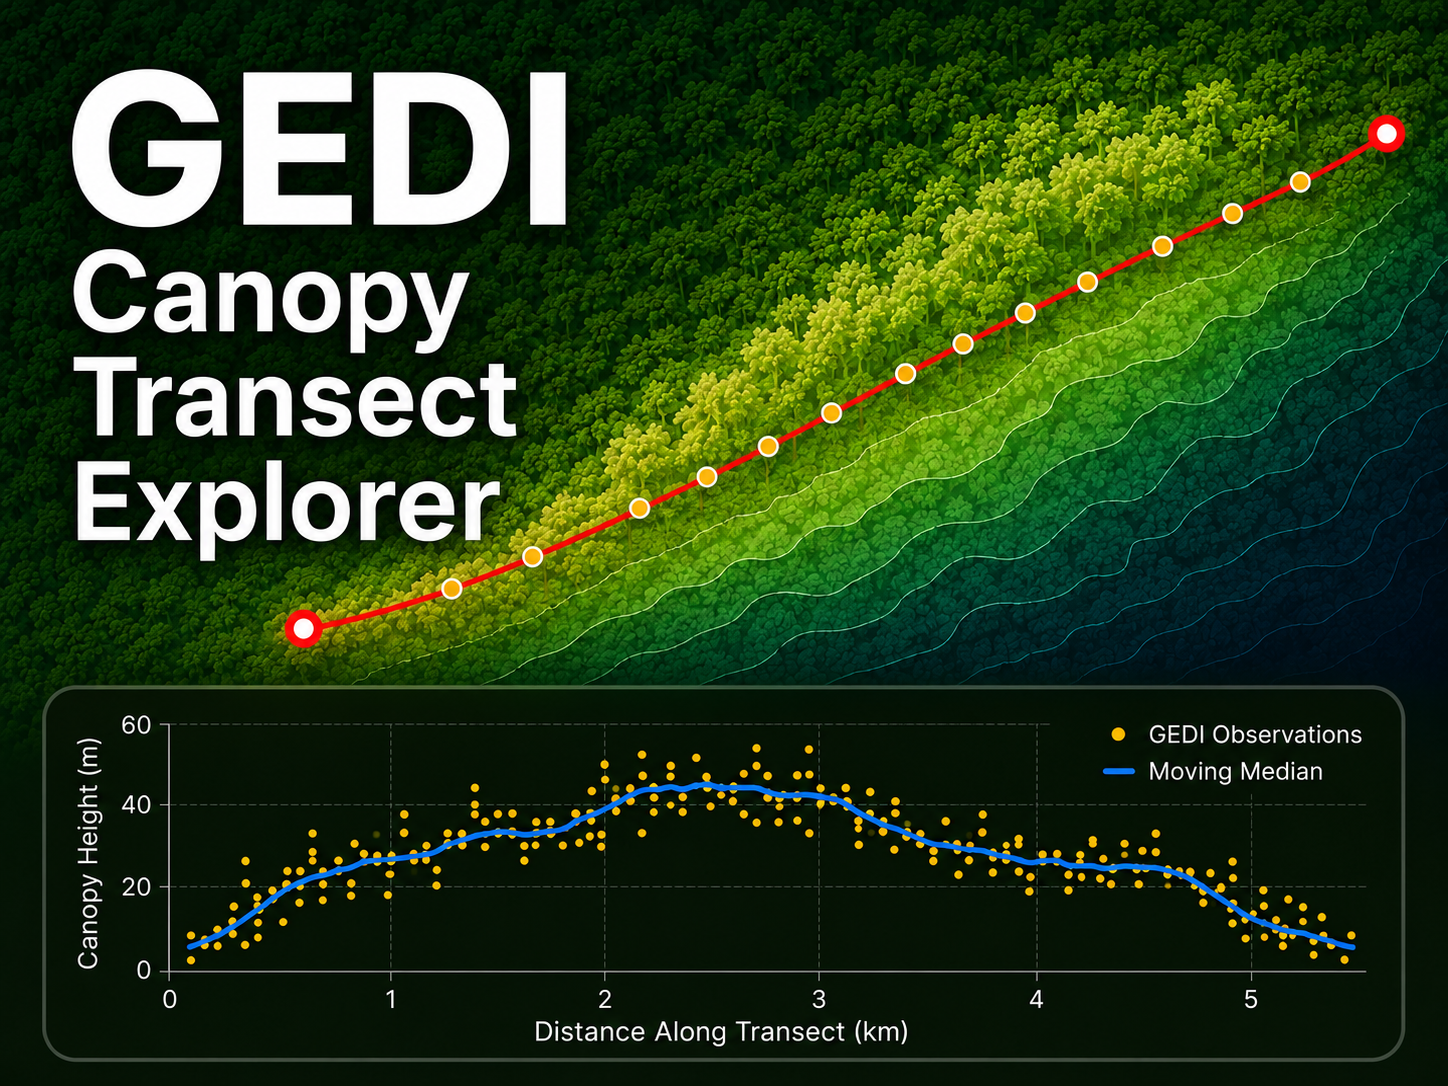
I developed the GEDI Canopy Transect Explorer, an interactive Google Earth Engine application for examining forest canopy-height patterns along user-defined landscape transects.
The app uses NASA GEDI Level 2A data to extract quality-filtered RH98 canopy-height observations near a line drawn by the user. It then summarizes the observations at regular intervals along the transect.
Why a transect-based tool?
Canopy-height maps are useful for regional analysis, but they can make it difficult to examine how forest structure changes across a specific landscape gradient.
A transect profile provides a different perspective. It can help explore transitions such as:
lowland to upland forest
valley to ridge
forest edge to interior
young to mature forest
disturbed to undisturbed areas
managed to protected forest
GEDI does not provide continuous wall-to-wall measurements. Its observations occur within discrete footprints along orbital tracks. The app therefore presents a GEDI-supported canopy-height profile, rather than a continuous measurement of every location along the line.
How the app works
The user draws a straight or multi-segment transect on the map and selects the analysis settings.
The app then:
identifies GEDI observations within a specified buffer around the transect
applies waveform quality, degradation, sensitivity, and plausible-height filters
assigns each GEDI observation a cumulative distance along the transect
creates regularly spaced profile points
calculates local canopy-height statistics within a moving window
reports where GEDI sampling is sufficient or insufficient
The moving-window median provides a robust estimate of the local canopy-height trend. It reduces the influence of unusually high or low observations while retaining meaningful landscape-scale variation.
Main outputs
The app produces four interactive profiles.
Canopy-height profile
This chart combines raw GEDI RH98 observations with a moving-window median calculated at fixed intervals along the transect.
Terrain and canopy-top profile
The terrain profile uses SRTM elevation as an approximate terrain surface. Canopy-top elevation is calculated by adding GEDI RH98 to the terrain elevation.
SRTM is not a lidar-derived bare-earth terrain model, so this output should be interpreted as an approximate landscape profile.
Local canopy-height variability
The app calculates the 25th percentile, median, and 75th percentile of RH98 observations within each moving window.
These statistics show both the local canopy-height trend and structural variability.
Sampling support
A separate chart reports the number of GEDI observations available within each moving window.
Sections without enough observations remain unsupported rather than being interpolated. This prevents the app from displaying apparent forest information where GEDI coverage is inadequate.
Adjustable settings
Users can modify:
observation start and end dates
transect buffer width
Profile-point spacing: The distance between consecutive summary points along the transect. For example, a spacing of 100 m creates profile points at 0, 100, 200, and 300 m. Smaller spacing produces a more detailed profile but requires more computation. Larger spacing produces a simpler, coarser profile.
Moving-window width: The total distance around each profile point used to collect nearby GEDI observations. A 500 m window includes observations within 250 m before and 250 m after the profile point. A narrow window preserves local variation but may contain too few observations. A wider window gives more stable estimates but smooths local changes.
Minimum waveform sensitivity: The lowest accepted GEDI sensitivity value. Sensitivity ranges from 0 to 1 and indicates the maximum canopy cover through which GEDI is expected to detect the ground. A threshold of 0.90 keeps observations with sensitivity values of at least 0.90. Higher thresholds are more conservative but reduce the number of available observations.
Minimum observations per window: The smallest number of GEDI observations required to calculate a local median and quartiles. A value of 3 means that a profile point is displayed only when at least three observations fall inside its moving window. Higher values improve statistical support but create more unsupported gaps.
Maximum plausible RH98 value: The upper canopy-height limit accepted by the app. RH98 is the height below which 98% of the returned waveform energy occurs and is commonly used as a canopy-top-height proxy. A maximum of 80 m removes extreme or implausible values above 80 m. The appropriate limit depends on the expected forest height in the study region.
Recommended exploratory defaults:
Profile-point spacing:          100 m
Moving-window width:            500 m
Minimum waveform sensitivity:  0.90
Minimum observations/window:      3
Maximum plausible RH98:          80 m
The app also reports:
transect length
number of raw GEDI observations
number of supported profile points
percentage of the transect with adequate support
median RH98
largest unsupported gap
Intended use
The application is designed for exploratory forest-structure analysis, teaching, and remote-sensing demonstrations.
Potential applications include:
comparing canopy structure across topographic gradients
identifying changes between forest conditions
exploring GEDI sampling density
evaluating the effects of quality-filtering choices
supporting field-transect planning
introducing lidar-derived forest metrics to students
The results should not be interpreted as field measurements or continuous canopy-height observations. They depend on GEDI footprint availability, acquisition conditions, filtering thresholds, transect placement, and moving-window parameters.
Technology
The application was developed entirely in Google Earth Engine using:
GEDI Level 2A monthly raster data
SRTM elevation data
Earth Engine drawing tools
spatial and distance-based joins
fixed-interval profile points
interactive Earth Engine charts
The current version focuses on GEDI RH98 canopy height. A future version could incorporate GEDI Level 2B vegetation-profile metrics, land-cover information, disturbance history, or lidar-derived terrain models.
Try the app
Open the GEDI Canopy Transect Explorer
The application uses public datasets and is intended as an open exploratory tool.