Terrain affects drainage, accessibility, disturbance patterns, and forest conditions. In this activity, you will use SRTM elevation data in Google Earth Engine to create basic terrain products for the Forêt Duparquet area.
This exercise introduces a simple raster workflow in GEE: load an image, clip it to a region of interest, derive new layers, display results, summarize values, and export a raster.
Learning objectives
By the end of this activity, you should be able to:
load a raster dataset in GEE
define and display a region of interest
clip a raster to a study area
derive slope, aspect, and hillshade from elevation
calculate summary statistics with
reduceRegion()export a raster product to Google Drive
Concept
The Shuttle Radar Topography Mission (SRTM) provides elevation data. Elevation is useful on its own, but it can also be used to derive other terrain variables that help describe the landscape.
In this activity, we create three common terrain products:
Slope: steepness of the surface
Aspect: direction a slope faces
Hillshade: shaded relief layer used for visual interpretation
These products help describe the physical landscape and can support later analyses, such as forest classification or disturbance interpretation.
Complete GEE script
Copy the script below into the GEE Code Editor.

// ------------------------------------------------------------
// SRTM terrain products for the Forêt Duparquet ROI
// ------------------------------------------------------------

// 1. Define the region of interest
var roi = ee.Geometry.Polygon([
  [
    [-79.50241092370698, 48.3829536766289],
    [-79.1741943709726, 48.3829536766289],
    [-79.1741943709726, 48.53958791639697],
    [-79.50241092370698, 48.53958791639697],
    [-79.50241092370698, 48.3829536766289]
  ]
]);

// 2. Load SRTM 30 m elevation data
var srtm = ee.Image("USGS/SRTMGL1_003");

// 3. Clip elevation to the ROI
var dem = srtm.clip(roi);

// 4. Derive terrain products
var slope = ee.Terrain.slope(dem);
var aspect = ee.Terrain.aspect(dem);
var hillshade = ee.Terrain.hillshade(dem);

// 5. Visualization parameters
var demVis = {
  min: 250,
  max: 450,
  palette: [
    "#006400",
    "#7FFF00",
    "#FFFF00",
    "#FFA500",
    "#8B4513"
  ]
};

var slopeVis = {
  min: 0,
  max: 30,
  palette: ["white", "yellow", "orange", "red"]
};

var aspectVis = {
  min: 0,
  max: 360,
  palette: [
    "blue", "cyan", "green", "yellow", "orange", "red", "purple"
  ]
};

var hillshadeVis = {
  min: 0,
  max: 255,
  palette: ["black", "white"]
};

// 6. Display layers
Map.centerObject(roi, 11);

Map.addLayer(dem, demVis, "SRTM elevation");
Map.addLayer(slope, slopeVis, "Slope");
Map.addLayer(aspect, aspectVis, "Aspect");
Map.addLayer(hillshade, hillshadeVis, "Hillshade");
Map.addLayer(roi, {color: "red"}, "ROI", false);

// 7. Calculate elevation statistics
var elevStats = dem.reduceRegion({
  reducer: ee.Reducer.minMax()
    .combine({
      reducer2: ee.Reducer.mean(),
      sharedInputs: true
    })
    .combine({
      reducer2: ee.Reducer.stdDev(),
      sharedInputs: true
    }),
  geometry: roi,
  scale: 30,
  maxPixels: 1e13
});

print("Elevation statistics for the ROI:", elevStats);

// ------------------------------------------------------------
// Export DEM to Google Drive
// ------------------------------------------------------------

// Export.image.toDrive({
//   image: dem,
//   description: "srtm_elevation_forest_duparquet",
//   folder: "GEE_exports",
//   fileNamePrefix: "srtm_elevation_forest_duparquet",
//   region: roi,
//   scale: 30,
//   crs: "EPSG:32617",
//   maxPixels: 1e13
// });
Script explanation
Define the ROI
The ROI is a rectangular study area around Forêt Duparquet. It limits the analysis, display, statistics, and export.
var roi = ee.Geometry.Polygon([...]);Load SRTM
var srtm = ee.Image("USGS/SRTMGL1_003");
var dem = srtm.clip(roi);
SRTM is loaded as an ee.Image. Clipping creates a new image for the study area without changing the original dataset.
Create terrain products
var slope = ee.Terrain.slope(dem);
var aspect = ee.Terrain.aspect(dem);
var hillshade = ee.Terrain.hillshade(dem);
Earth Engine provides built-in terrain functions. These functions use the elevation image to calculate slope, aspect, and hillshade.
Slope is measured in degrees from 0 to 90.
Aspect is measured from 0 to 360 degrees, where north is 0 or 360, east is 90, south is 180, and west is 270.
Hillshade is a visual layer that simulates terrain illumination, which makes landforms easier to interpret. In Earth Engine, the default hillshade uses light from the west, with an azimuth of 270° and an elevation angle of 45° above the horizon. It is used for visual interpretation, not as a physical measure of sunlight.
Display layers
Map.addLayer(dem, demVis, "SRTM elevation");
Map.addLayer(slope, slopeVis, "Slope");
Map.addLayer(aspect, aspectVis, "Aspect");
Map.addLayer(hillshade, hillshadeVis, "Hillshade");
Map.addLayer() displays a layer in the Code Editor map. Visualization parameters control color and value range.
Calculate elevation statistics
var elevStats = dem.reduceRegion({
  reducer: ee.Reducer.minMax()
    .combine({
      reducer2: ee.Reducer.mean(),
      sharedInputs: true
    })
    .combine({
      reducer2: ee.Reducer.stdDev(),
      sharedInputs: true
    }),
  geometry: roi,
  scale: 30,
  maxPixels: 1e13
});
reduceRegion() summarizes raster values inside a geometry. Here, it calculates minimum, maximum, mean, and standard deviation of elevation within the ROI.
Export the DEM
Export.image.toDrive({
  image: dem,
  description: "srtm_elevation_forest_duparquet",
  folder: "GEE_exports",
  fileNamePrefix: "srtm_elevation_forest_duparquet", // if Earth Engine splits the export into tiles
  region: roi,
  scale: 30,
  crs: "EPSG:32617",
  maxPixels: 1e13
});
This block creates an export task for the clipped DEM in the Earth Engine Tasks tab. After running the script, open the Tasks tab and click Run to save the raster to Google Drive.
The export uses EPSG:32617, which is WGS 84 / UTM Zone 17N. This CRS is suitable because the ROI falls within UTM Zone 17. If you need to align the raster with Québec provincial datasets, EPSG:32198 can also be used. This corresponds to NAD83 / Québec Lambert, a common projection for Québec-wide geospatial data.
Expected outputs
After running the script, you should see:
ROI boundary
elevation, slope, aspect, and hillshade layers
elevation statistics in the Console
If you uncomment the export block, an export task will appear in the Tasks tab.
Result example
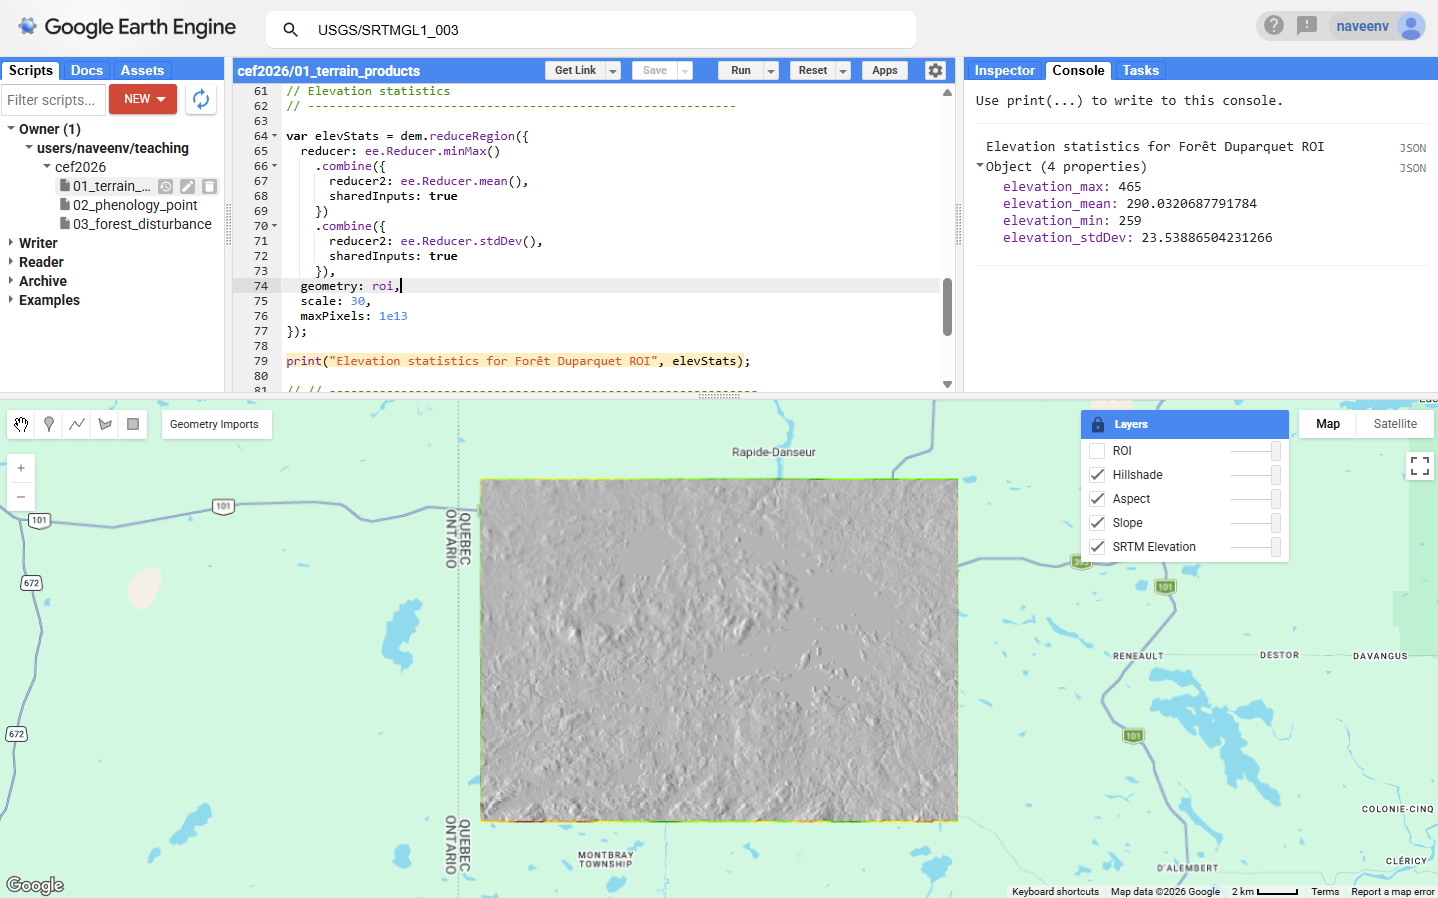
Elevation, slope, aspect, and hillshade derived from SRTM for the rectangular study area around Forêt Duparquet.
Interpretation notes
Elevation, slope, and aspect help describe physical landscape variation.
Higher areas may indicate ridges or uplands. Lower areas may correspond to wetlands, lakeshores, or low-lying terrain. Steep slopes can affect access, road placement, harvesting operations, drainage, and erosion risk. Aspect can influence solar exposure, snowmelt, soil moisture, and vegetation patterns.
Hillshade is useful for visual interpretation, but it should not be treated as a quantitative terrain variable.
Questions
Where are the highest elevations in the ROI?
Where are the steepest slopes?
What landforms are visible in the terrain layers?
How could terrain affect forest access or management operations?
Which terrain product is easiest to interpret visually?
Which terrain variables could be useful predictors in a forest classification model?
Answers
The highest elevations appear in the upland or ridge areas of the ROI, shown by the warmest colors in the elevation map.
The steepest slopes occur where elevation changes rapidly over short distances. These areas appear in orange or red on the slope map.
The terrain layers can reveal ridges, lowlands, depressions, drainage zones, and lake margins. Hillshade is especially useful for visual landform interpretation.
Steep terrain can limit machinery access, increase road construction costs, and increase erosion risk. Low-lying or wet terrain can also restrict access because of poor drainage or seasonal flooding.
Hillshade is usually the easiest terrain product to interpret visually because it gives a shaded relief view of the landscape.
Elevation, slope, and aspect can all be useful predictors. Elevation can represent broad environmental gradients, slope can relate to drainage and accessibility, and aspect can represent differences in solar exposure and moisture.
Optional extension
Try changing the visualization ranges.
For example, modify the elevation range:
var demVis = {
  min: 270,
  max: 420,
  palette: ["green", "yellow", "brown"]
};
Or change the reducer used to calculate elevation statistics. For example, replace ee.Reducer.minMax() with:
ee.Reducer.median() // median valueThen rerun the script and compare the map. Visualization settings do not change the data values, but they strongly affect how patterns appear on the map.